
Two Weeks Online: What Thousands of Bot Requests Revealed About the Modern Web

Twoo weeks after launching blogsite.me, I expected the usual early-stage website activity: a few search-engine crawlers, some indexing attempts, and hopefully the first human visitors discovering the articles.
What I did not expect was how quickly automated traffic would begin surrounding the website.
Search-engine crawlers arrived.
AI crawlers followed.
SEO tools appeared.
Then came vulnerability scanners, scripts looking for WordPress installations, PHP probes, automated HTTP clients, and bots requesting files that had never existed on the server.
This article continues my previous experiment, “Robots.txt, Cloudflare, and the Beginning of a Bot Observatory.”
What started as a simple investigation into how Cloudflare modifies robots.txt gradually became a much larger observability project.
I wanted to answer a different question:
What actually happens to a newly published website when it becomes visible on the public Internet?
The answer, based on the first weeks of data, was more interesting than I expected.
A public website is not simply waiting for people to visit it.
It is constantly being discovered, crawled, tested, indexed, scanned, and probed by automated systems.
Instead of relying only on conventional web analytics, I started collecting data from three different layers of the infrastructure.
The first source was an application-level logger inside CodeIgniter 4:
visitor_logs
It records automated clients that actually reach the application.
The second source was the Apache access log:
apache_requests
This captures requests that reach the origin server, including requests that never correspond to a valid application route.
The third source came from Cloudflare:
cloudflare_security_events
This provides visibility into activity detected at the edge before or while traffic is being evaluated by Cloudflare security rules.
Conceptually, the observation points look like this:
Internet
   ↓
Cloudflare
   ↓
Apache
   ↓
CodeIgniter
Each layer sees a slightly different version of reality.
That distinction became important almost immediately.
At one snapshot of the experiment, the three sources contained: Source Records Unique IPs
| Source | Records | Unique IPs |
|---|---|---|
| Application bot logger | 5,353 | 103 |
| Apache origin requests | 2,008 | 190 |
| Cloudflare Security Events | 93 | 13 |
These numbers cannot simply be added together.
An automated client may appear in more than one source.
For example, the same crawler might:
reach Cloudflare
↓
pass security checks
↓
reach Apache
↓
reach CodeIgniter
↓
be recorded again by the application
To avoid treating the same IP as several different entities, I built an aggregation layer called:
bot_ip_features
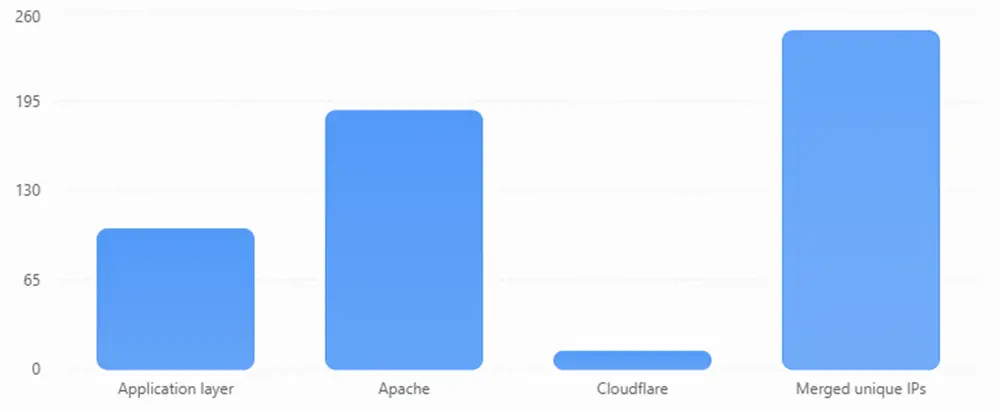
For the rolling seven-day observation window, the feature builder detected:
102 IPs from visitor_logs
188 IPs from Apache
13 IPs from Cloudflare
A simple sum would produce:
303
But after merging duplicate IP addresses across the three sources, the actual result was:
246 unique IP addresses
That difference is important.
It means that multiple observability layers were often seeing the same actors from different parts of the request lifecycle.
Seven-day observation window. Source counts overlap; merged unique IPs are deduplicated across layers.
One of the clearest lessons from the experiment is that the public Internet finds new websites very quickly.
Within roughly two weeks, blogsite.mehad already accumulated thousands of automated observations.
Some of those systems were expected.
Search engines crawled the site.
AI-related crawlers requested articles.
SEO tools analyzed pages.
Social-media infrastructure fetched metadata.
But other systems behaved very differently.
They were not looking for content.
They were looking for software.
Or more precisely, they were looking for software that might not even be installed.
Suggested graphic: Data Sources vs Unique IPs
The word bot is too broad to describe what appeared in the logs. The automated traffic could roughly be divided into several behavioral groups.
The expected visitors included crawlers associated with search engines such as:
Googlebot
Bingbot
Applebot
Their requests generally focused on legitimate public resources such as:
/
articles
sitemap.xml
This is normal behavior for a public website. Search engines need to discover and index content. But even in this category, User-Agent strings alone cannot be treated as proof of identity.
Any HTTP client can claim:
User-Agent: Googlebot
So the Observatory treats bot identity and bot behavior as separate concepts.
The logs also showed tools associated with SEO analysis and automated web intelligence.
Examples included:
SemrushBot
DataForSeoBot
AhrefsBot
Their request patterns differed from normal search-engine crawling.
Some crawlers moved rapidly through multiple article URLs within short periods.
That does not necessarily make them malicious.
It simply illustrates that machine traffic has its own behavioral rhythms.
AI-related crawlers also appeared early.
GPTBot, for example, requested several articles even though the website was still very young.
That was particularly interesting because the original Bot Observatory experiment began with a question about AI crawlers and robots.txt.
The investigation therefore came full circle.
What started as:
Should AI crawlers be allowed?
eventually became:
What kinds of automated systems are interacting with the website at all?
The most interesting data came from clients that were clearly not behaving like normal content crawlers.
Instead of reading published articles, they requested paths commonly associated with:
WordPress
PHP diagnostics
configuration files
administrative interfaces
plugin vulnerabilities
backup files
The strange part was that blogsite.me does not use many of those technologies.
The application runs on CodeIgniter 4.
Yet the server received repeated requests for WordPress endpoints.
That reveals something important about Internet-wide scanning.
Many scanners do not begin by carefully identifying a site's technology stack.
They simply try large collections of common paths.
The homepage remained the most frequently requested legitimate resource:
/
80 requests
71 unique IPs
3 responses with HTTP 404
But immediately below it, the request distribution changed dramatically.
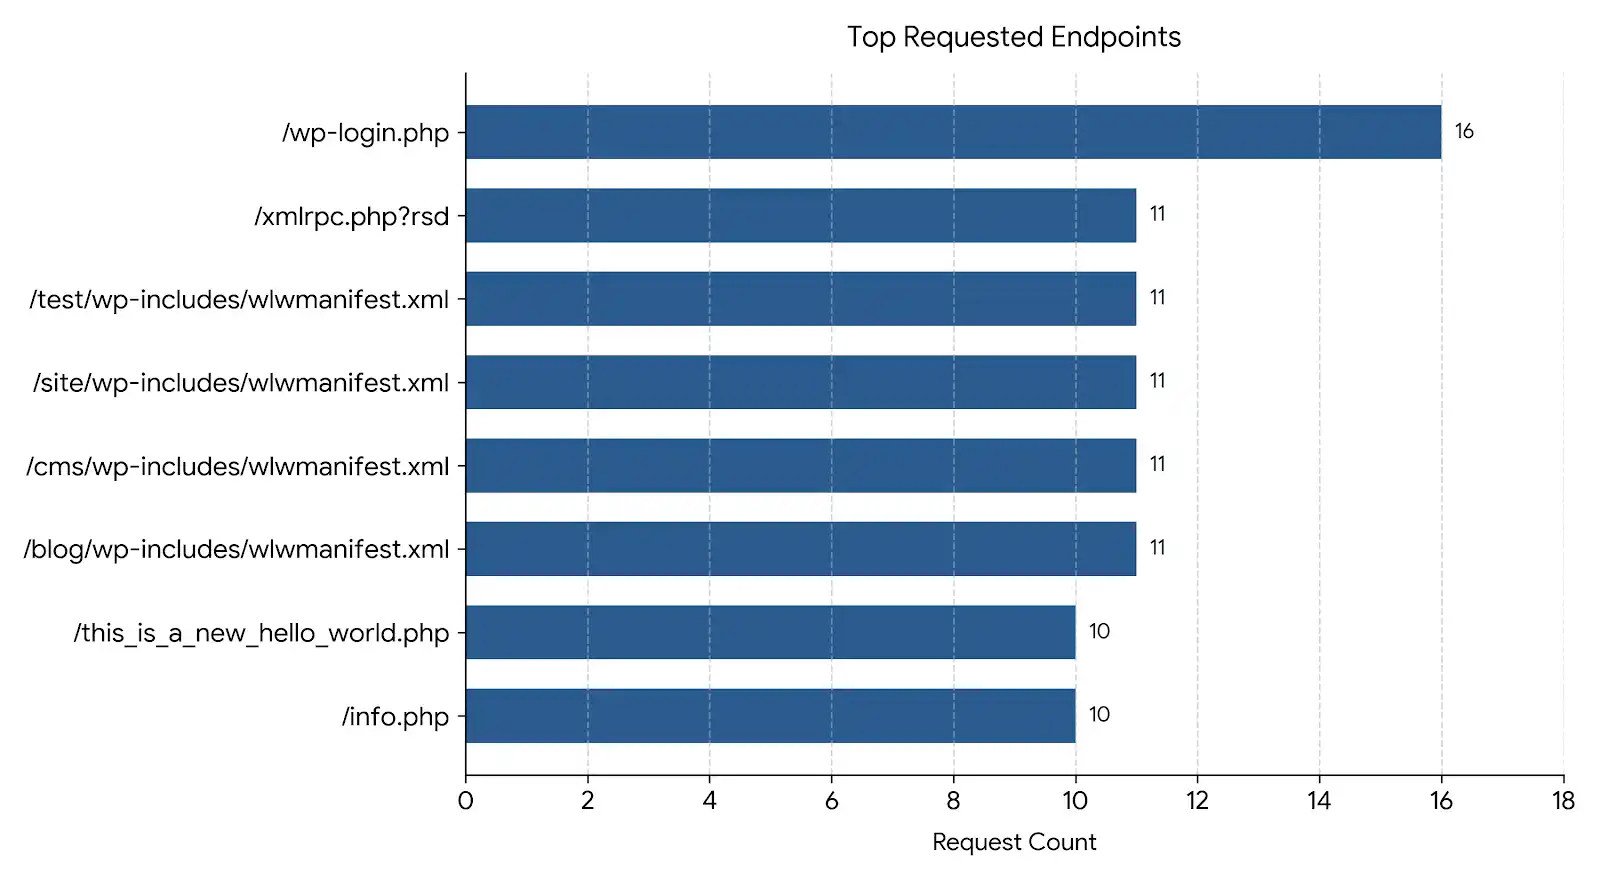
The most frequently requested missing path was:
/wp-login.php
It received:
16 requests
12 unique IPs
16 HTTP 404 responses
Every request failed.
That makes sense.
There is no WordPress installation on blogsite.me.
But the probing did not stop there.
Other frequently requested paths included:
//blog/wp-includes/wlwmanifest.xml
//cms/wp-includes/wlwmanifest.xml
//site/wp-includes/wlwmanifest.xml
//test/wp-includes/wlwmanifest.xml
//web/wp-includes/wlwmanifest.xml
//wordpress/wp-includes/wlwmanifest.xml
//wp/wp-includes/wlwmanifest.xml
//wp1/wp-includes/wlwmanifest.xml
//xmlrpc.php?rsd
Many of these variants were requested by several unrelated IP addresses.
The scanners were clearly checking multiple common WordPress installation locations.
Other observed paths included:
/info.php
/this_is_a_new_hello_world.php
/wp-content/plugins/hellopress/wp_filemanager.php
Again, these files do not belong to the application.
In application development, HTTP 404 usually means:
resource not found
From a security-observability perspective, however, repeated 404 responses can tell a much more interesting story.
A visitor requesting one broken URL is normal.
A search engine requesting an outdated page is also normal.
But an IP requesting dozens or hundreds of unrelated paths, with nearly every request returning 404, suggests enumeration behavior.
That pattern appeared clearly in bot_ip_features.
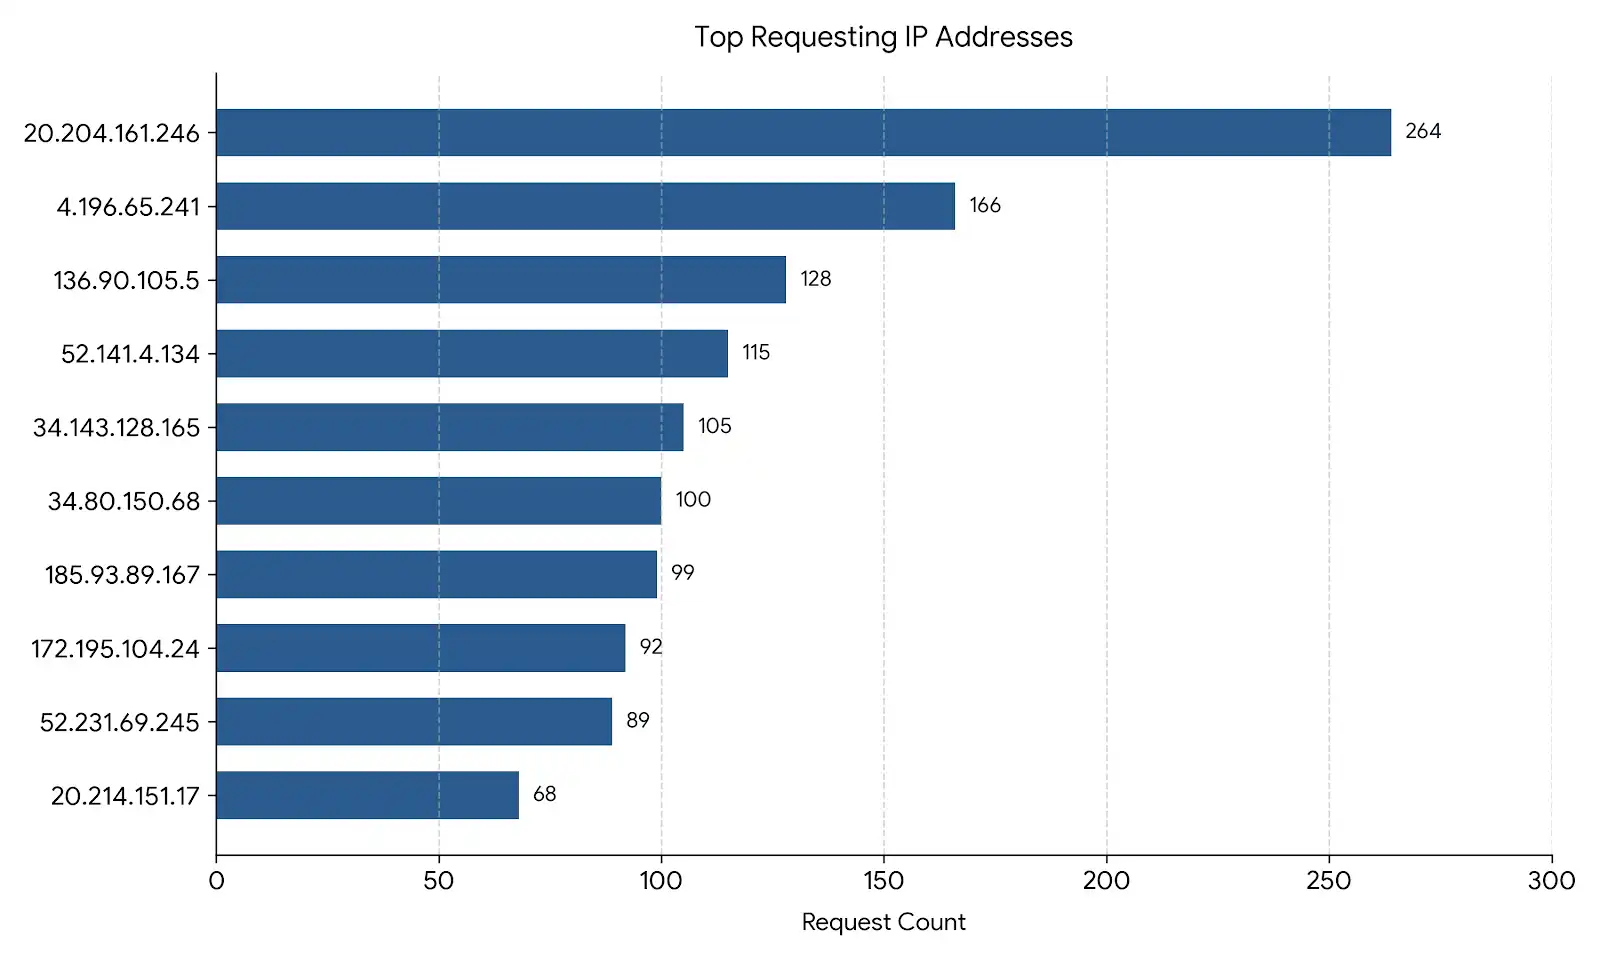
The most active observed IP generated:
264 requests
66 unique URLs
260 HTTP 404 responses
Its 404 ratio was approximately:
98.5%
Another IP generated:
166 requests
162 unique URLs
166 HTTP 404 responses
Its 404 ratio was:
100%
Several high-volume IPs showed similar behavior, with 404 ratios above 90% and heuristic risk scores between 95 and 100.
The top examples included scanners producing:
128 requests / 115 HTTP 404
115 requests / 106 HTTP 404
105 requests / 99 HTTP 404
100 requests / 99 HTTP 404
This is why the Observatory does not treat HTTP status codes as isolated events.
Instead, it looks at combinations of features.
Thousands of log rows become difficult to interpret manually.
So instead of analyzing individual requests forever, I created one aggregated feature record per IP address.
The current feature set includes metrics such as:
apache_request_count
apache_unique_urls

apache_404_count
apache_404_ratio

apache_requests_per_minute

php_probe_count
wp_probe_count
sensitive_path_probe_count

cloudflare_event_count
cloudflare_block_count
cloudflare_skip_count
cloudflare_challenge_count

first_seen
last_seen
activity_duration_seconds
This transforms the analysis from:
What did this request do?
into:
How does this IP behave?
That distinction is important.
A single request rarely tells the full story.
Patterns do.
The feature data revealed another important pattern.
The ten most active IP addresses generated:
1,226 Apache requests
out of:
2,008 total Apache requests
That is approximately:
61%
of the recorded origin traffic.
In other words, a relatively small group of automated clients was responsible for a disproportionately large share of the observed requests.
The most active IP alone generated 264 requests.
This concentration matters because raw request totals can make traffic appear broader than it actually is.
The current top entries are:
The time distribution was not uniform either.
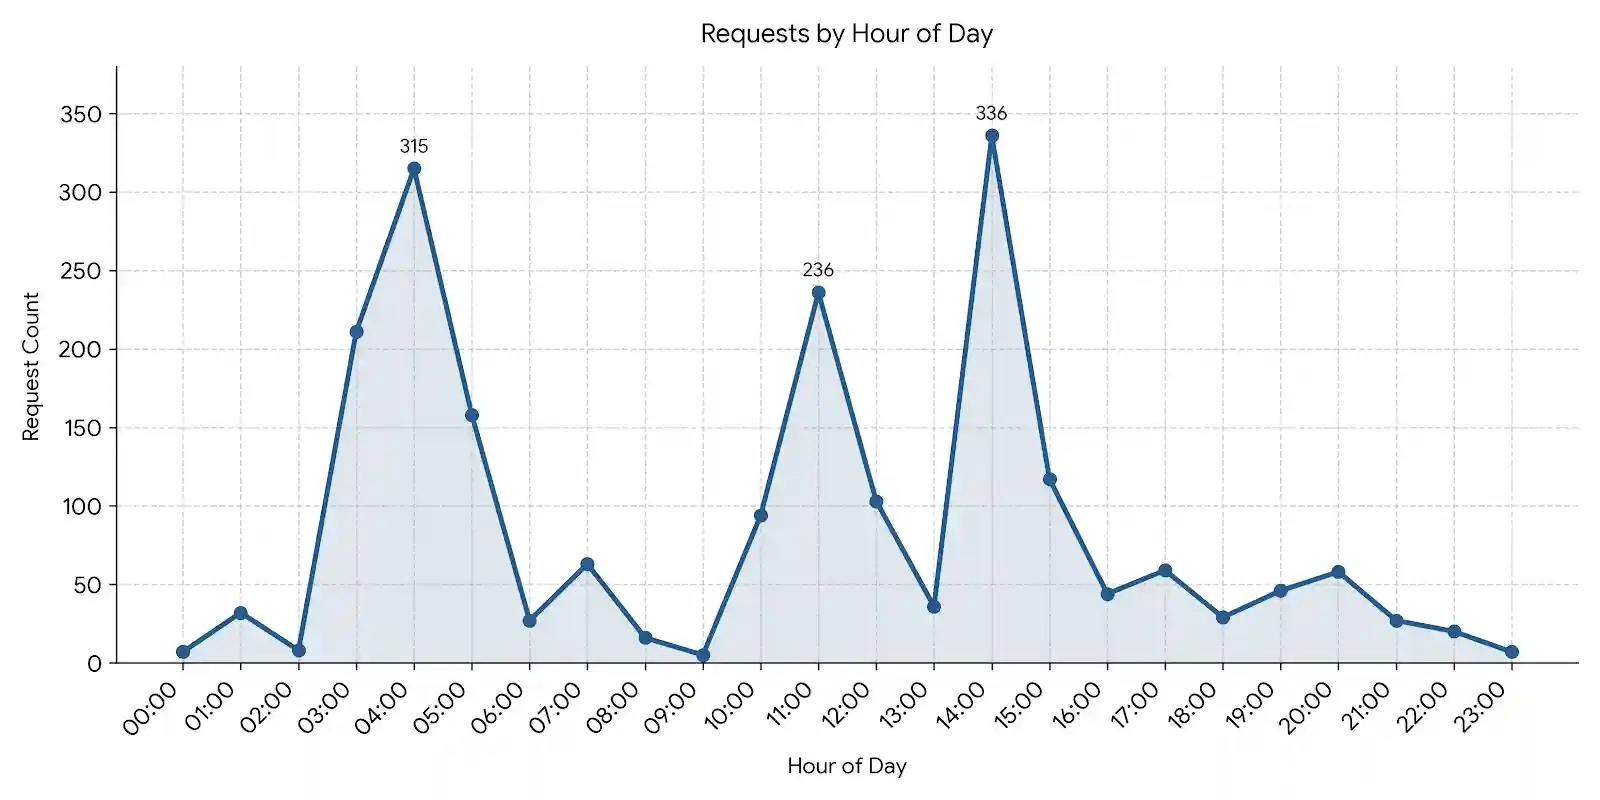
The busiest observed hour was:
14:00
336 requests
22 unique IPs
Another major spike occurred at:
04:00
315 requests
4 unique IPs
And another at:
11:00
236 requests
4 unique IPs
These numbers reveal two different traffic patterns.
At 14:00, activity was spread across 22 IP addresses.
At 04:00, nearly the same volume came from only four.
That concentration makes the second pattern much more interesting.
It does not automatically prove malicious activity.
But it tells us that the behavior at 04:00 was structurally different from the behavior at 14:00.
Another scanner pattern observed earlier involved roughly:
20 requests
within approximately 3 seconds
Most of those requests returned:
HTTP 404
The client identified itself as:
Go-http-client/1.1
This illustrates why request velocity matters.
Compare:
20 requests in one day
with:
20 requests in three seconds
The raw count is identical.
The behavior is not.
That is why requests_per_minute became one of the important features in the Bot Observatory.
Some scanner IPs showed extremely high request rates.
For example, one IP produced:
128 requests per minute
while another reached:
100 requests per minute
in the current feature dataset.
Once the feature layer existed, I added a simple rule-based classifier.
The current labels include:
scanner
crawler
aggressive_bot
cloudflare_flagged
low_activity_bot
unknown
The goal is not to claim certainty.
These are behavioral labels.
For example, an IP may be classified as a scanner when several conditions appear together:
high 404 ratio
many unique URLs
WordPress probes
PHP probes
sensitive-path probes
high request rate
The accompanying risk_score is also heuristic.
A value such as:
risk_score = 100
does not mean:
100% probability of malicious activity
It simply means that multiple predefined signals were present.
This distinction will become important when the project moves from rule-based analysis toward clustering and anomaly detection.
Cloudflare also became an important part of the experiment.
Initially, I considered bypassing it so that the origin server could observe everything directly.
After several days of testing, that approach seemed less useful.
Cloudflare provided a different layer of information.
Its Security Events data showed activity that interacted with security rules before or while requests were evaluated at the edge.
At the time of this snapshot, the dataset contained:
93 Cloudflare Security Events
13 unique IP addresses
The volume was much smaller than Apache because Cloudflare Security Events do not represent every HTTP request.
They represent security-related observations.
That distinction matters.
A normal crawler reaching an article may appear in Apache but never appear as a Cloudflare security event.
A request blocked at the edge may appear in Cloudflare but never reach Apache.
Neither dataset replaces the other.
For this experiment, Cloudflare Free proved useful in three areas.
First, it allowed custom security rules to evaluate suspicious request patterns before they reached the application.
Second, Security Events provided an additional source for correlation.
Third, it offered enough visibility to compare what happened at the edge with what actually reached the origin.
The important lesson was not:
Cloudflare sees everything.
It does not.
The lesson was:
Edge telemetry and origin telemetry answer different questions.
This is why Bot Observatory combines:
Cloudflare
+
Apache
+
CodeIgniter
rather than depending on only one layer.
One of the most useful comparisons in the experiment was between normal crawling and enumeration.
A normal crawler may request:
/
/sitemap.xml
/article-one
/article-two
/category/cloud
A scanner may request:
/wp-login.php
/xmlrpc.php
/info.php
/.env
/phpmyadmin
/wp-content/plugins/...
The difference is not simply the User-Agent.
It is the shape of the behavior.
That is exactly what bot_ip_features is designed to capture.
It would be tempting to conclude:
Most Internet traffic is generated by bots.
But this experiment does not prove that.
The dataset represents one young technology website.
The logging pipeline was also deliberately designed to observe automated activity.
It would therefore be incorrect to generalize the result to every website or the entire Internet.
What the experiment does demonstrate is narrower and more defensible:
A newly published website can attract substantial automated activity almost immediately, and a large part of the traffic visible at the server and security layers may come from crawlers, scanners, and other automated systems rather than ordinary human browsing.
That conclusion is already significant.
Traditional analytics may show only a handful of human visitors.
Meanwhile, the infrastructure beneath the application may be processing thousands of automated requests.
The next step in Bot Observatory is IP geolocation.
The plan is to enrich each aggregated IP with approximate metadata such as:
country
city
ASN
latitude
longitude
Then the dashboard can plot observed bot activity on a world map.
The goal will not be to claim an exact physical location.
IP geolocation is approximate.
Instead, the visualization will provide a geographic view of the infrastructure generating automated traffic.
Eventually, selecting an IP should reveal something like:
IP address
↓
country / city
↓
network / ASN
↓
first seen
↓
last seen
↓
request count
↓
unique URLs
↓
404 ratio
↓
request velocity
↓
targeted paths
↓
Cloudflare events
↓
behavior label
At that point, Bot Observatory will become less like a simple log viewer and more like a small network-behavior research platform.
After watching this traffic for only a few weeks, I have started thinking about the Internet less like a collection of websites and more like an ocean.
Publishing a website is like putting a small vessel into that ocean.
Search engines will discover it.
Crawlers will inspect it.
Scanners will probe it. Bots will request files that were never created.
Some systems are useful. Some are harmless.
Some are noisy.
Some may be searching for weaknesses.
And most of them do not care whether the website is large, famous, profitable, or only two weeks old.
No website owner can control the entire ocean.
Cloudflare cannot stop every wave.
A firewall cannot understand every client.
A server cannot prevent every probe from reaching its public address.
The practical question is not how to control everything.
It is how well we observe what is happening, how intelligently we respond, and how carefully we navigate.
The Internet is an ocean. No one truly controls it. What matters is how we sail.